Sectors - Business
UK R&D Spending Increased by £70m
New figures released by HMRC show that UK construction companies are increasing their investment in innovation, with research and development (R&D) expenditure rising by £70 million.
Analysis from IronmongeryDirect has revealed that in the first half of 2018/19, construction companies spent around £1.36 billion on qualifying projects. Even though many claims have yet to be submitted for that financial year, this is already around 5.4% more than the previous year.
Using the UK Government’s R&D Tax Credit Scheme, companies can claim back up to 33p in every pound spent on R&D activity. This includes any project that aims to advance the industry by researching or developing a new process, product or service, or improvements to an existing one.
More companies in the sector are starting to take advantage of the scheme, with the latest data showing the overall number of claims is also on the rise. So far, construction businesses have made 3340 claims for R&D funding, a year-on-year increase of 1.8% (60). The industry now represents 5.7% of all R&D claims in the UK.
The majority of the construction-related R&D projects are classed as ‘specialised construction activities’. These account for two-thirds (66%) of the sector’s claims, way ahead of ‘construction of buildings’ in second place (21%).
However, the most valuable construction R&D claims are those labelled as ‘civil engineering’. Across the whole industry, the average R&D claim in 2018/19 was worth £70,359 – almost 5% higher (£3,286) than the year before (£67,073) – but the figure is far greater for civil engineering projects. The typical amount of tax relief awarded to such work is £129,412.
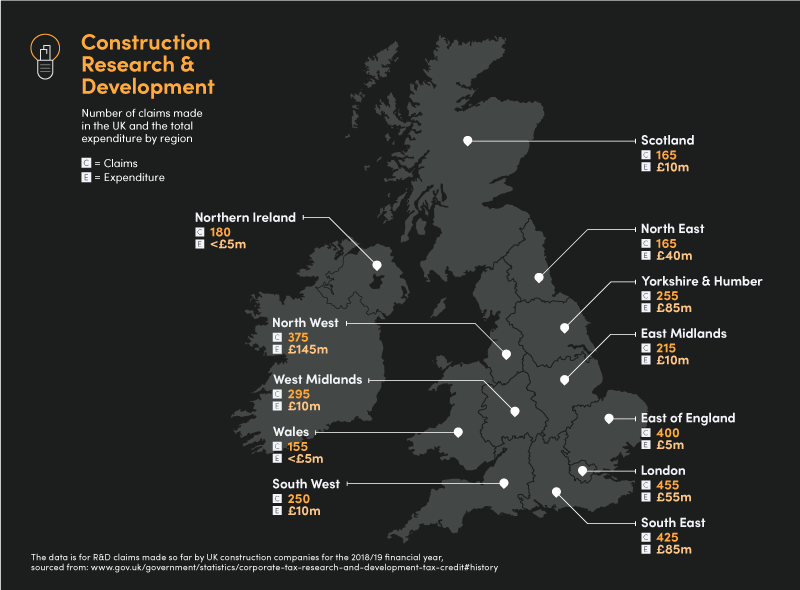
The totals also vary significantly across the UK. The most innovative area is London, with more claims made in the capital than any other part of the nation (455).
The regions which have made the most and least claims for construction R&D funding for 2018/19, so far, are:
- London – 455 (£55m)
- South East – 425 (£85m)
- East of England – 400 (£5m)
- North West – 375 (£145m)
- West Midlands – 295 (£10m)
- Yorkshire and the Humber – 255 (£85m)
- South West – 250 (£10m)
- East Midlands – 215 (£10m)
- Northern Ireland – 180 (<£5m)
- North East – 165 (£40m)
- Scotland – 165 (£10m)
- Wales – 155 (<£5m)
If you would like to read more stories like this, then please click here


Related Articles
- Planning for the Future of Aggregate Logistics
8 Dec 21
As the UK takes its first steps to recovery from the pandemic, construction activity is
- How Can SME Developers Gain a Competitive Edge in the Market?
18 Nov 21
SME developers are not on top today. 40 years ago, 2 out of every 5
- House Prices Rise Again in September
18 Nov 21
Average house prices in the UK increased by 11.8% over the year to September 2021,